FragMAXapp offers a variety of visualisation tools, including plots displaying data quality and statistics, and electron density maps visualisation.
Results view
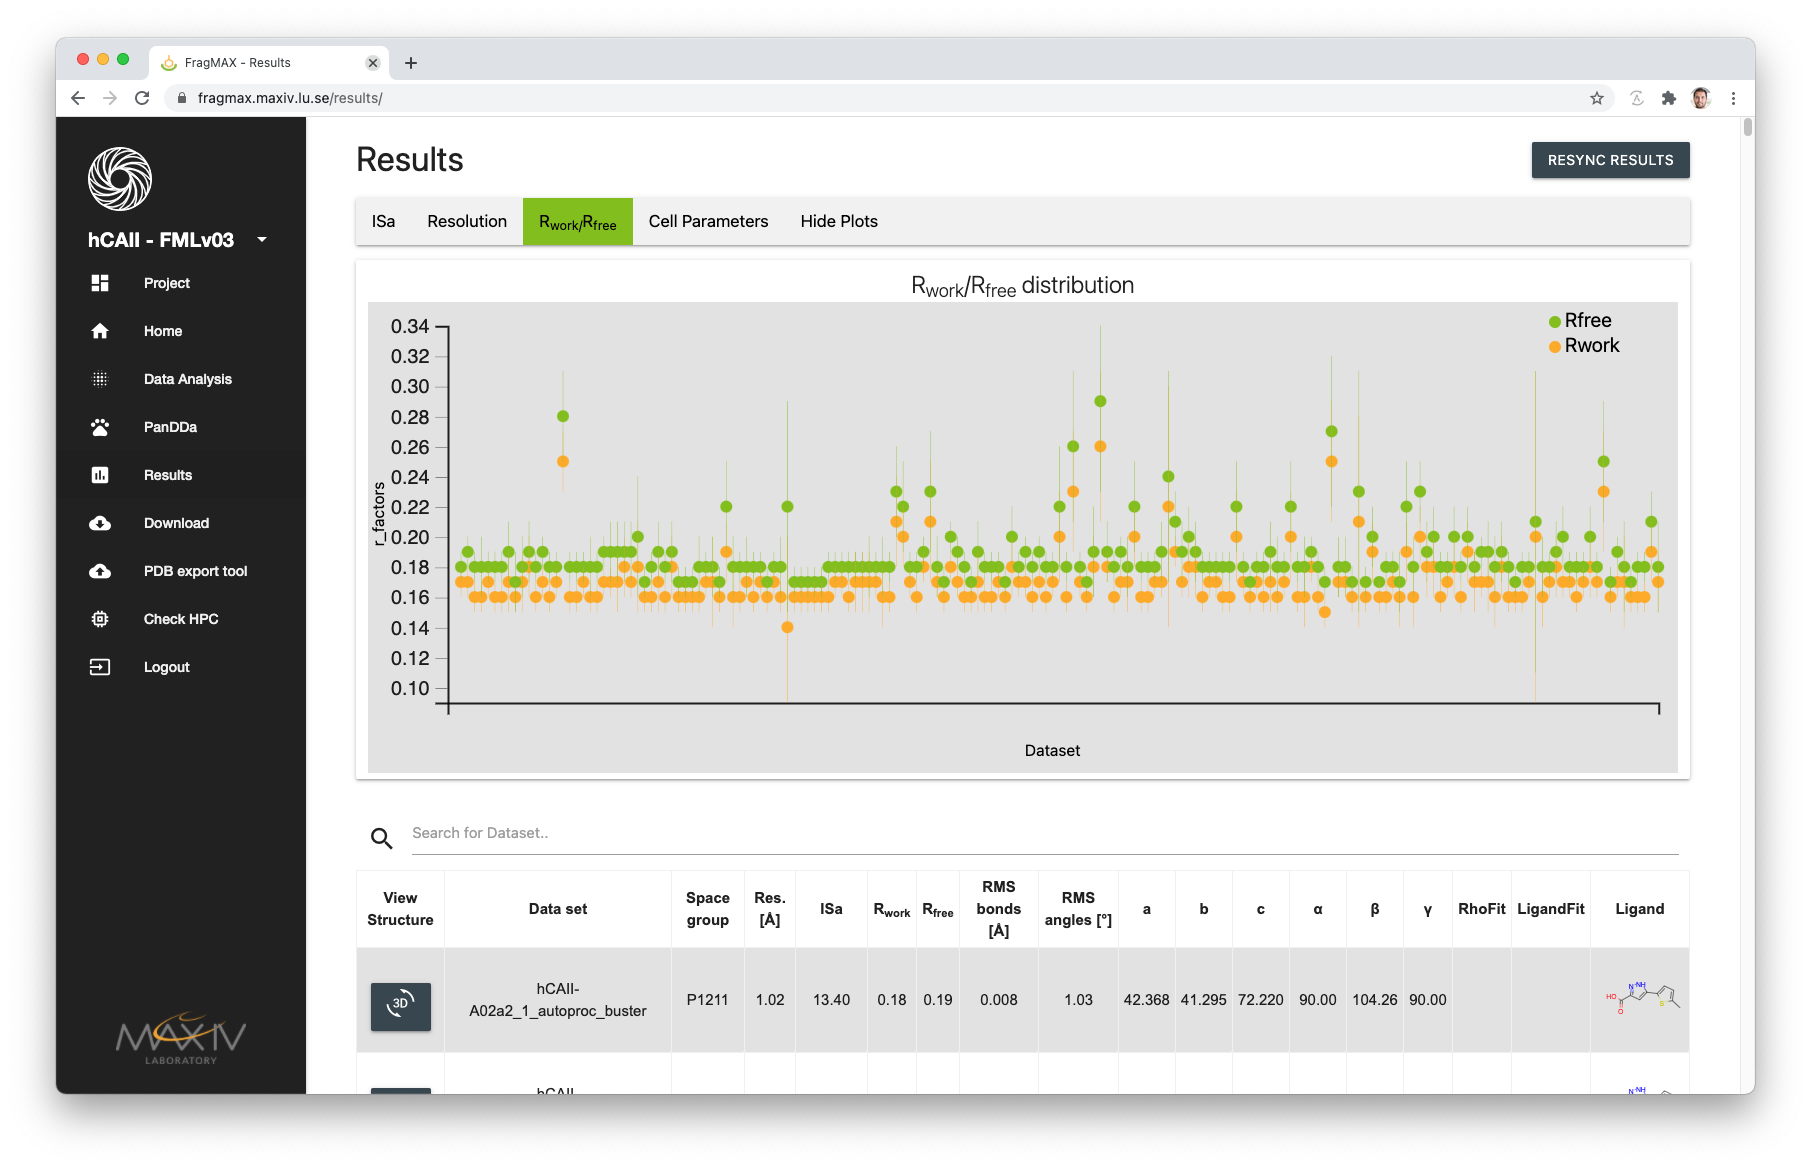
Plots
The top bar under Results page will display a responsive plot of data statistics and results distribution.
Plot display:
The points are the average value of a given parameter calculate using all results available.
The vertical line represents the maximum and minimum values for the same parameter.
If you click-and-drag the mouse on the plot (zoom-in), a sub selection of the datasets is done. This will filter the table below, displaying the results available on the plot ONLY.
To move back to the previous view, with all datasets, double click anywhere in the plot to reset the zoom level.
Moving with mouse cursor over a point will display information about the dataset.
Results view
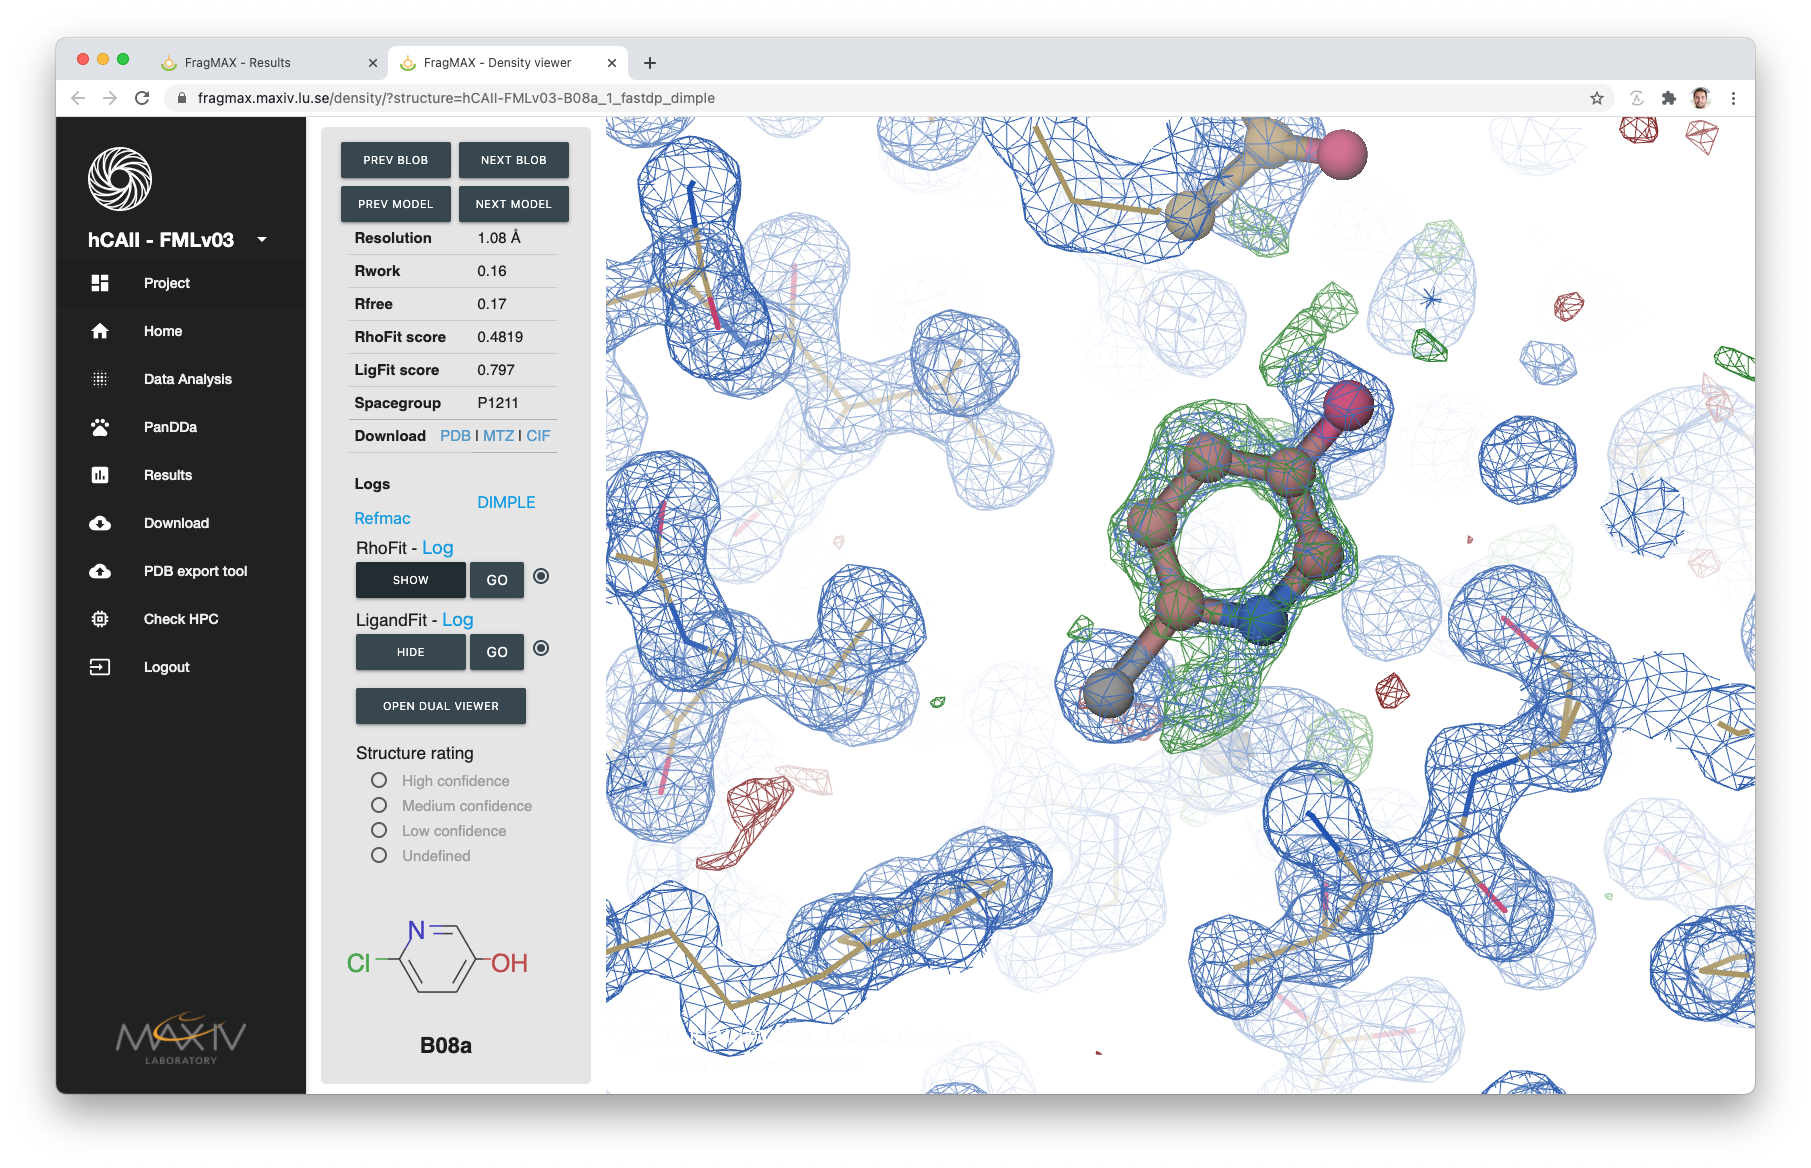
All structures presented in FragMAXapp can be visualised using uglyMOL viewer.
In the density page view, the left manu bar gives basic controls and information about the structure presented.
| Function | Effect |
|---|---|
| Next/Prev Blob | Move the view to the blobs found by the structure refinement method. Using arrow keys on the keyboard will result in the same effect |
| Next/Prev Model | Move to another model in the project. The next and previous refers to an alphebetical order of available results. |
| Download options | Downloads the referred file. |
| RhoFit/LigandFit buttons | Controls visibility of the ligand placed using the referred method or move the view to the ligand. |
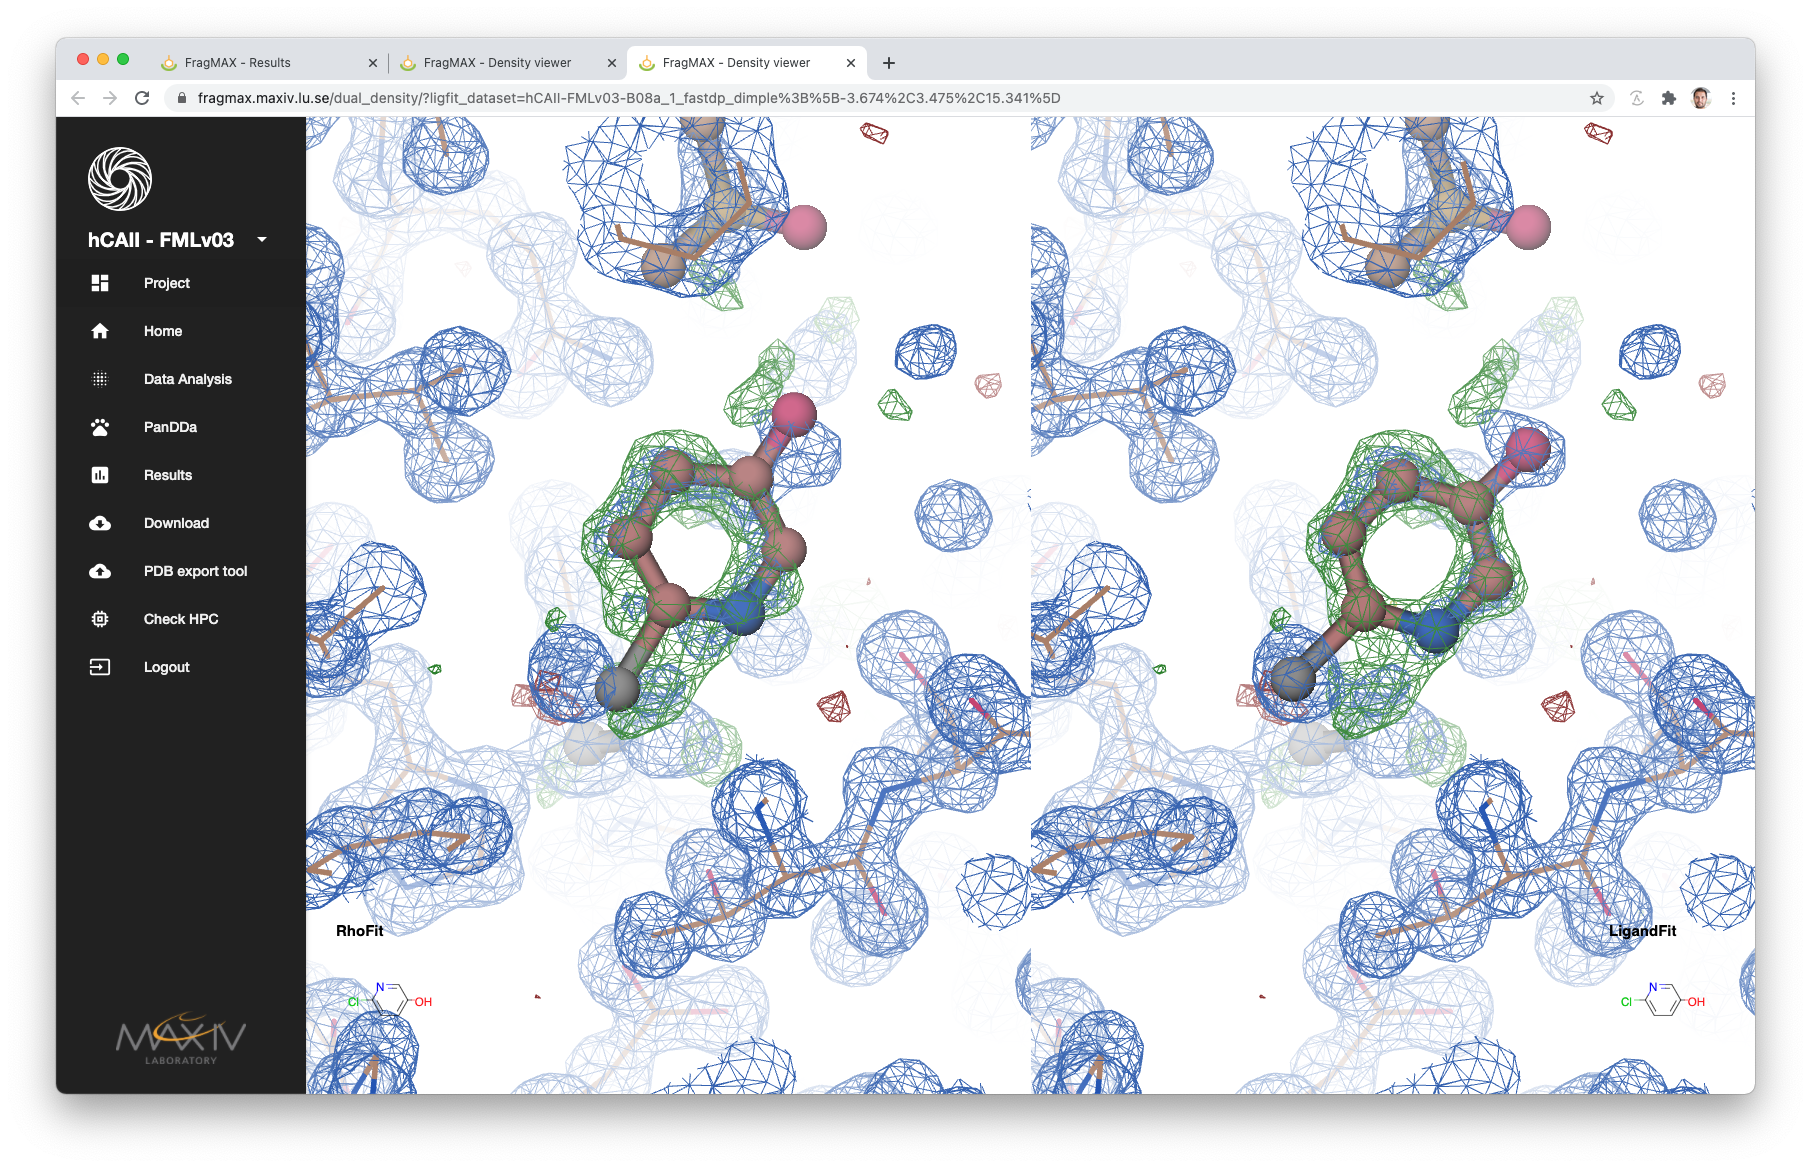
| Open dual viewer | Available only both methods are available. Opens both ligands side by side, with a unified view control for comparison |
| Structure rating | User based entry to score the result. This can be used for filtering results for download |
| Fragment structure | 2D representation of the SMILES provided in the project definition. The representation is created by RDKit |